Rivian CEO RJ Scaringe's startup Mind Robotics announced the appointment of Doug Field as president in a major coup for the CEO's secretive robotics project. Field was a VP of special projects at Apple, where he was the de facto head of the company's ultimately unsuccessful Project Titan effort to make an autonomous electric car. He had a previous stint at Apple as VP of Mac hardware engineering, but he left the company in 2013 to become Tesla's chief vehicle engineer, where he helped oversee the Model 3 sedan. He left Tesla in 2018 and rejoined Apple. In 2021, Field was hired by Ford to run the automaker's electric vehicle and software di … Read the full story at The Verge.
EcoFlow is dominating our Tuesday Green Deals edition this week, as the brand is offering an early-bird $50 “lock in” deposit for its latest TITAN Series Whole-Home Backup System that will be officially launched in November. Right behind that is the latest 48-hour flash sale lineup, with options like the DELTA Pro Power Station bundle with a 400W solar panel down at $2,279, and more from $689. We also spotted Heybike offering its Mars 3.0 Folding Full Suspension e-bike at a new $1,099 low, a bunch of Anker eufy Solar Wall Light Cam S4 deals starting from $200, a 40V 12-inch Greenworks Cordless Snow Shovel kit at a new $240 low, and more. You’ll also find the hangover deals from yesterday at the bottom of the page, like the Segway’s GT3 superscooter at its lowest price, the exclusive Anker SOLIX 6,144Wh expanded F3000 bundle deal, and more. Head below for other New Green Deals we’ve found today and, of course, Electrek’s best EV buying and leasing deals. Also, check out the new Electrek Tesla Shop for the best deals on Tesla accessories. more…
Mexican manufacturers produced 15,181 heavy-duty vehicles during September, compared with 6,857 in the same month last year. Exports totaled 12,707 units, up 144.6% from September 2025, marking a significant acceleration in cross-border commercial vehicle shipments, according to figures from Mexico’s National Institute of Statistics and Geography (INEGI) presented by the National Association of Bus, Truck and Tractor-Trailer Producers (ANPACT). The September rebound comes as Mexico’s domestic heavy-duty vehicle market continues to struggle with weak sales, delayed fleet replacement decisions and uncertainty surrounding U.S. trade policies. Rogelio Arzate, executive president of ANPACT, said growing demand from U.S. customers preparing for new emissions standards has been a major factor behind the increase in production and exports. window.googletag = window.googletag || {cmd: []}; googletag.cmd.push(function() { var gptSlot = googletag.defineSlot('/21776187881/FW-Responsive-Main_Content-Slot1', [[300, 100], [320, 50], [728, 90], [468, 60]], 'div-gpt-ad-1709668545404-0').defineSizeMapping(gptSizeMaps.banner1).addService(googletag.pubads()); googletag.pubads().enableSingleRequest(); googletag.pubads().collapseEmptyDivs(); googletag.enableServices(); setInterval(function() { if (!document.hidden) { googletag.pubads().refresh([gptSlot]); } }, 30000); }); googletag.cmd.push(function() { googletag.display('div-gpt-ad-1709668545404-0'); }); “The reason why production and exports are growing at the levels they are is precisely because the United States, our main trading partner, is currently undergoing this technology shift,” Arzate said during an October news conference. Arzate pointed to the transition toward U.S. Environmental Protection Agency emissions standards scheduled for 2027, which is prompting manufacturers and customers to adjust their purchasing and production plans. “Clients are currently requesting a significant number of units as well, and that is why this production and export toward the United States is increasing,” Arzate said. The growth highlights Mexico’s role as a major production hub for commercial trucks sold throughout North America, even as manufacturers navigate tariffs, evolving emissions requirements and the upcoming review of the United States-Mexico-Canada Agreement. US remains Mexico’s largest heavy-duty truck export market Mexico exported 98,394 heavy-duty vehicles during the first nine months of 2026, an increase of approximately 12% compared with the same period last year, according to ANPACT. window.googletag = window.googletag || {cmd: []}; googletag.cmd.push(function() { var gptSlot = googletag.defineSlot('/21776187881/fw-responsive-main_content-slot3', [[728, 90], [468, 60], [320, 50], [300, 100]], 'div-gpt-ad-1665767553440-0').defineSizeMapping(gptSizeMaps.banner1).addService(googletag.pubads()); googletag.pubads().enableSingleRequest(); googletag.pubads().collapseEmptyDivs(); googletag.enableServices(); setInterval(function() { if (!document.hidden) { googletag.pubads().refresh([gptSlot]); } }, 30000); }); googletag.cmd.push(function() { googletag.display('div-gpt-ad-1665767553440-0'); }); Of those shipments, 98,389 were freight vehicles, representing a 12.1% year-over-year increase. The U.S. remained the industry’s dominant export destination, receiving 90,967 Mexican-built heavy-duty vehicles from January through September, up 9.6% from the comparable 2025 period. That means the U.S. accounted for approximately 92.5% of Mexico’s heavy-duty vehicle exports during the first nine months of the year. Canada also recorded gains, with shipments increasing 47.6% year over year through September. During September alone, Mexico exported 680 heavy-duty vehicles to Canada, more than doubling the volume recorded a year earlier. Other markets showing year-to-date growth included Colombia, Peru, Honduras and Guatemala, while exports to Chile, El Salvador, Ecuador and Costa Rica declined. window.googletag = window.googletag || {cmd: []}; googletag.cmd.push(function() { var gptSlot = googletag.defineSlot('/21776187881/fw-responsive-main_content-slot4', [[300, 100], [320, 50], [728, 90], [468, 60]], 'div-gpt-ad-1709668086344-0').defineSizeMapping(gptSizeMaps.banner1).addService(googletag.pubads()); googletag.pubads().enableSingleRequest(); googletag.pubads().collapseEmptyDivs(); googletag.enableServices(); setInterval(function() { if (!document.hidden) { googletag.pubads().refresh([gptSlot]); } }, 30000); }); googletag.cmd.push(function() { googletag.display('div-gpt-ad-1709668086344-0'); }); The export gains accompanied a broader recovery in Mexican commercial vehicle manufacturing. During the January-through-September period, Mexican factories produced 117,121 heavy-duty vehicles, an increase of 10.3% from the same period in 2025. Freight vehicles accounted for 114,443 units of that production. Diesel-powered vehicles continued to dominate the industry’s manufacturing and export activity. ANPACT reported no electric or natural gas-powered heavy-duty vehicles produced or exported during September. Domestic truck sales continue to struggle Despite stronger manufacturing and export activity, Mexico’s domestic heavy-duty vehicle market remained under pressure. Cristina Vázquez, coordinator of economic studies at the Mexican Association of Automotive Distributors (AMDA), said retail sales totaled 2,980 heavy-duty vehicles in September, down 11.3% from the same month in 2025. window.googletag = window.googletag || {cmd: []}; googletag.cmd.push(function() { var gptSlot = googletag.defineSlot('/21776187881/fw-responsive-main_content-slot5', [[728, 90], [468, 60], [320, 50], [300, 100]], 'div-gpt-ad-1665767778941-0').defineSizeMapping(gptSizeMaps.banner1).addService(googletag.pubads()); googletag.pubads().enableSingleRequest(); googletag.pubads().collapseEmptyDivs(); googletag.enableServices(); setInterval(function() { if (!document.hidden) { googletag.pubads().refresh([gptSlot]); } }, 30000); }); googletag.cmd.push(function() { googletag.display('div-gpt-ad-1665767778941-0'); }); The decline marked the eighth consecutive month of year-over-year decreases in Mexico’s heavy-duty vehicle retail market. Through the first nine months of 2026, retail sales totaled 25,289 vehicles, a 17.5% decline from the comparable period last year. Sales of tractor-trailers were particularly weak. Mexican dealers sold 1,153 tractor-trucks during September, down 14% year over year. Sales of other freight trucks increased slightly, rising 0.5% to 1,378 units. window.googletag = window.googletag || {cmd: []}; googletag.cmd.push(function() { var gptSlot = googletag.defineSlot('/21776187881/fw-responsive-main_content-slot6', [[728, 90], [468, 60], [320, 50], [300, 100]], 'div-gpt-ad-1665767872042-0').defineSizeMapping(gptSizeMaps.banner1).addService(googletag.pubads()); googletag.pubads().enableSingleRequest(); googletag.pubads().collapseEmptyDivs(); googletag.enableServices(); setInterval(function() { if (!document.hidden) { googletag.pubads().refresh([gptSlot]); } }, 30000); }); googletag.cmd.push(function() { googletag.display('div-gpt-ad-1665767872042-0'); }); Combined, the freight vehicle segment recorded 2,531 retail sales, down 6.7% from September 2025. Passenger vehicle sales, including buses, fell 30.5% to 449 units. Vázquez said Mexico’s commercial vehicle market has yet to recover from a surge in purchases during 2024, when fleet operators accelerated acquisitions ahead of regulatory changes. The record sales that year effectively pulled forward demand that otherwise might have occurred in 2025 and 2026. She also cited uncertainty surrounding U.S. trade policies and the upcoming USMCA review as factors discouraging fleet operators from making major investments. The market’s continued weakness comes despite signs of improvement in Mexico’s broader economy, including a rebound in fixed investment. AMDA projected annual heavy-duty vehicle retail sales of approximately 36,051 units in 2026 but cautioned that actual results could fall below that estimate if purchasing activity remains subdued. ANPACT pushes for tariff relief, fleet renewal programs Arzate said ANPACT is working with Mexican authorities to address U.S. tariffs on commercial vehicles and components as the North American automotive industry prepares for the USMCA review. The association is seeking lower tariffs and wants to preserve existing regional rules of origin, which require manufacturers to meet increasing North American content thresholds. Arzate said manufacturers have made substantial investments in their supply chains and production facilities to comply with the agreement. He said the industry’s preferred outcome would be eliminating U.S. tariffs imposed under Section 232 of the Trade Expansion Act, although reducing those duties may be a more achievable near-term goal. “In an ideal world, we should have zero tariffs,” Arzate said. ANPACT is also working with Mexico’s Ministry of Finance and Ministry of Economy on programs aimed at encouraging domestic fleet replacement. The initiatives include accelerated depreciation, financing guarantees and a proposed scrappage program designed to remove older commercial vehicles from service. Arzate said the association is coordinating with Nacional Financiera, Mexico’s development bank, on additional financial incentives to help carriers purchase newer equipment. September 2026: Key industry figures Why it matters: The surge underscores Mexico’s importance to North American truck manufacturing as fleets prepare for regulatory changes and trade uncertainty. More FreightWaves articles by Noi Mahoney: Mexico trucker shortages, visa restrictions squeeze cross-border capacity Texas trucking firm sued over age limits on drivers New Jersey CDL school lawsuit questions evidence behind FMCSA shutdown The post Mexico truck exports soar 145% as US demand accelerates appeared first on FreightWaves.
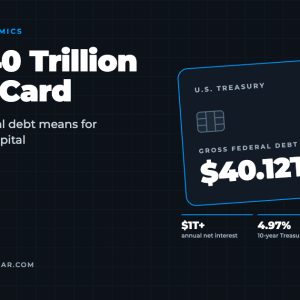
Key takeaways U.S. gross federal debt passed $40 trillion in August 2026; about $32.4 trillion of it is held by the public. Net interest on the debt now runs above $1 trillion a year and eats roughly 18.5% of federal revenue, a record. Heavy Treasury borrowing competes with private borrowers for capital (“crowding out”), adding upward pressure on interest rates, though the near-term rate story is still mostly inflation and the Fed. Freight feels it first: truck loans start around 7.9% to 8.9%, Class 8 orders are down year over year, small carriers are under strain, and warehouse development costs more to finance. Anyone planning a fleet replacement cycle or a long-term warehouse lease should model both Fed policy and the structural deficit. On last week’s Freightonomics show, we discussed CBO rule-of-thumb numbers on how much an increase in the interest rate (as shown by the Effective Federal Funds Rate) would impact the debt. I had in my mind publicly held debt when I said it was somewhere in the neighborhood of $34T. Turns out I transposed a couple numbers and was thinking 34.2 (getting old stinks). It’s actually $32.4T, which is still not good. I looked this morning to see what the total U.S. debt total currently is. That number is worse yet. Source: usdebtclock.org, 09/23/2026 Gross federal debt crossed $40 trillion in mid-August 2026, months earlier than most forecasters had penciled in, as the Washington Post reported at the time, and it has held in that neighborhood since, touching $40.12 trillion in Treasury’s own daily debt-to-the-penny data as of September 21. Of that total, $32.4 trillion is debt held by the public and $7.7 trillion is intragovernmental, per Congress’ Joint Economic Committee Debt Dashboard. Debt held by the public alone is now running close to 100% of GDP (Debt Clock’s 122.75% is gross federal debt, public plus intragovernmental), and the Congressional Budget Office projects that ratio to reach 120% by 2036 and 175% within thirty years, surpassing the 1946 postwar record of 106% along the way. The debt has roughly doubled in under a decade. Before we go further, we need to talk about scale. “Trillion” looks fine on paper, but it is difficult to wrap our heads around just how big that number is. To be perfectly honest, one almost needs a metaphor to understand the metaphor, but I’m going to try my best. I don’t want to bore you with too many conversions, but we need to establish some foundations for this. Let’s assume that each dollar of federal debt is one drop of water, 1/20th of a milliliter, or 1/100th of a teaspoon. On my kid’s medicine syringe, 1 tsp = 5 ml; so that math checks out. Following our earlier assumption, that means each teaspoon is a $100 bill of debt. According to World Aquatics, a long-run Olympic-sized swimming pool is 50m x 25m x 2.5m or about 164’1” x 82’ x 8’2”. This means it holds 3,125,000 liters of water, or 825,538 gallons. That means each pool holds 62.5 billion drops. For a federal debt of $40.1T, that means almost 642 pools. Imagine trying to swim that, much less drink that much. If you drank a gallon of water a day, it would take you 2,260 years to down all that. (See what I meant about the metaphor needing a metaphor?) For freight and logistics, the headline number is not the worrying thing by itself. It’s what a debt stock this large, growing this fast, does to the price of capital, and freight is one of the most capital-intensive, most interest-rate-sensitive sectors in the economy. Interest on the national debt now tops $1 trillion a year One small bit of good news is that neither we nor the federal government need to drink that much pool water, at least not all at once. Federal debt gets bought and sold, comes due and gets reissued, on a constant basis. One credit card gets paid off, another gets issued. But, the feds have to pay interest on the money they borrow, just like everyone else. This cost is called “servicing” the debt. And, since the feds both borrow debt and gain interest on balances held (just like in your savings account), the reported numbers are the net of the two. Net interest on the debt ran $1.02 trillion for the first eleven months of FY26, up 9% from $933 billion over the same span in FY25, and annualized interest costs crossed the $1 trillion mark in August, according to the Peterson Foundation’s interest tracker. Interest is now the second-largest line in the federal budget after Social Security, ahead of defense and Medicare individually and, on a 2025 full-year basis, ahead of the entire defense budget outright, Fortune reported this month. Interest payments now consume roughly 18.5% of federal revenue, above the prior record of 18.4% set in 1991, and CBO projects that share to reach 25% by 2036, with cumulative net interest over the next decade totaling $16.2 trillion. None of that money buys roads, ports, or anything else freight moves for. It is a pure transfer to whoever holds the debt. How federal debt raises the cost of capital The 10-year Treasury yield sits at 4.97% as of this week, near a 19-year high, with hawkish Fed commentary on further rate hikes doing a good part of the near-term work, per Trading Economics’ yield tracker. That’s a useful caveat before reaching for the debt as the sole explanation: a meaningful share of the current move is monetary policy responding to inflation, not fiscal policy responding to the deficit. It’s also worth noting the 30-year yield, at roughly 5%, is ordinary by the standards of the last fifty years: it was around 8% in 1991 and over 10% before that, the same Fortune piece notes. Rates this high aren’t historically unprecedented, even if they’re a shock relative to the 2010s. That said, the deficit is doing its own work on the margin. FY26’s deficit is running around $1.9 to $2 trillion, or 5.8% of GDP, a level CBO itself flags as historically unusual with unemployment below 5%, a point the Peterson Foundation has made as well. That’s the textbook crowding-out setup: the Treasury needs buyers for an ever-larger volume of new debt, and it has to compete for the same pool of savings that would otherwise fund corporate bonds, mortgages, and equipment loans. As economist Ed Yardeni told Fortune, capital flowing into corporate bonds is capital not flowing into Treasuries, and Treasury yields have had to rise to clear the market. Treasury has also doubled its buyback operation size to $4 billion per transaction, a form of direct market management that analysts have described as blurring the line between routine cash management and yield control, which is itself a signal that debt absorption is not frictionless right now. The academic version of this is the Penn Wharton Budget Model’s capital crowd-out estimates: in a partially open economy where foreign investors finance about 40% of new issuance, each additional trillion dollars of non-productive borrowing is estimated to reduce the private capital stock by roughly 0.65% to 0.78% by mid-century and GDP by 0.23% to 0.28%. Scale that to the trillions being added annually now, and the effect compounds, though it is partly cushioned as long as foreign capital keeps showing up to buy Treasuries. Where higher interest rates show up in freight and trucking Equipment financing. Trucking runs on borrowed capital for its rolling stock, and commercial truck loan rates are currently starting around 7.90% to 8.90% for well-qualified borrowers, per LendingTree’s lender survey. That rate environment is a direct pass-through of the Treasury curve plus a lender’s margin. It shows up in the order books: preliminary Class 8 net orders for August 2026 came in around 13,000 to 13,200 units, down 14% to 19% year over year, the eighth straight year-over-year decline, and well below the ten-year average of roughly 23,100 units, Commercial Carrier Journal reported. FTR’s Dan Moyer points to fleets extending truck lifespans and absorbing higher maintenance costs rather than replacing equipment, with high interest rates cited as one factor among several, alongside tariff uncertainty and the 2027 EPA NOx standard. Financing cost isn’t the only story here, but it’s a real one. Small-carrier attrition. More than twenty trucking and logistics firms filed for bankruptcy in May 2026 alone, FreightWaves reported. The primary drivers FreightWaves points to are erratic demand and elevated operating costs, fuel chief among them, plus margins that stay thin even when spot rates rise, rather than financing costs specifically. But for the segment of the industry running on leased or financed equipment, a higher cost of debt is a background pressure that compounds every other stress carriers are already under, even where it isn’t the headline cause. Warehouse and DC development. Industrial building loan rates were around 6.58% as of June 2026, per SelectCommercial, and industrial bridge loans are running 7.5% to 9.5% this year, according to PeerSense. That raises the hurdle rate for new distribution center development at exactly the moment e-commerce and nearshoring are pushing demand for well-located industrial space. Slower new supply growth is a second-order effect worth watching for anyone modeling warehouse rents and network footprints over the next few years. Current market backdrop. For context, SONAR’s national snapshot as of September 22 shows tender rejections (STRI) at 14.21, up about 1% week over week and up 5.6% over the past month; spot rates at $3.43 per mile, up 48.7% year over year; and contract rates at $2.66 per mile, up 15.7% year over year. Diesel, meanwhile, is at a record national average of $6.53 per gallon, but that’s mostly a geopolitical story (the Iran conflict, Russian refinery strikes, a Russian export ban, and historically low inventories), not a debt story, as Logistics Management’s coverage of the EIA data makes clear. It’s worth keeping that distinction clean: rising rates are being driven by a mix of tight capacity, fuel cost pass-through, and the financing backdrop described above, and it would be a mistake to attribute all of it to Washington’s borrowing. SONAR Ticker: STRI.USA The honest takeaway for carriers, shippers and brokers The crowding-out case for freight isn’t that the debt is single-handedly setting truck loan rates or capping warehouse construction. It’s that a structurally larger, faster-growing debt load adds a persistent upward bias to the cost of capital across the economy, and freight, as one of the most financing-dependent, thin-margin sectors there is, feels that bias earlier and more acutely than most. The near-term rate story is still mostly about inflation and the Fed. The multi-decade story, with interest costs on a path to a quarter of federal revenue and debt-to-GDP heading well past the postwar record, is increasingly about the deficit itself. Anyone underwriting a fleet replacement cycle or a ten-year warehouse lease should be modeling both. Frequently asked questions How big is the U.S. national debt in 2026? Gross federal debt passed $40 trillion in mid-August 2026 and stood at about $40.12 trillion on September 21, per Treasury’s Debt to the Penny data. About $32.4 trillion is debt held by the public and $7.7 trillion is intragovernmental. How much does the federal government pay in interest on the debt? Net interest ran $1.02 trillion in the first eleven months of FY26, up 9% from the same span in FY25, and annualized interest costs crossed $1 trillion in August. Interest now takes about 18.5% of federal revenue, and CBO projects that share to reach 25% by 2036. What is crowding out, and how does it affect freight? Crowding out happens when heavy government borrowing competes with private borrowers for the same pool of savings, pushing interest rates higher. Freight is one of the most capital-intensive, rate-sensitive sectors, so higher borrowing costs show up quickly in truck financing, equipment orders, carrier margins, and warehouse development. Is the national debt the reason freight rates are rising? Not primarily. As of September 22, SONAR data shows tender rejections (STRI) at 14.21 and spot rates up 48.7% year over year, driven by tight capacity, record diesel prices, and the financing backdrop. The debt acts as a persistent background pressure on the cost of capital rather than the direct cause of today’s rate moves. Want to see how capacity, rates, and costs are moving in your lanes? Subscribe to SONAR for real-time freight market data. The post How National Debt Affects Freight Costs and Financing appeared first on FreightWaves.
The National Highway Traffic Safety Administration says it's evaluating allegations that Tesla's 1,000 or so robotaxis using its automated driving system are exceeding "posted speed limits in active school zones." Waymo's robotaxis have also faced similar inquiries, including for illegally passing school buses and hitting a child near a California elementary school. NHTSA: The Office of Defects Investigation (ODI) received a DP on September 23, 2026, requesting an investigation into model year (MY) 2026 Tesla Robotaxis (Model Y and Cybercab) with the Automated Driving System (ADS) engaged. The Petitioner alleges that the ADS exceeds poste … Read the full story at The Verge.
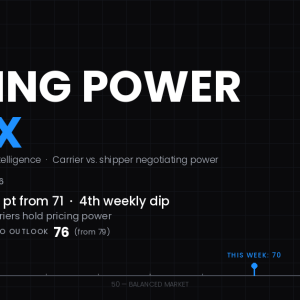
The SONAR Pricing Power Index (PPI) fell to 70 this week from 71, its fourth straight weekly decline, but freight carriers still hold the upper hand in rate negotiations. Softer intermodal contract rates and ocean import bookings drove the dip, while truckload tender rejections held steady near 13.9%. On the PPI’s 0–100 scale, 50 represents a historically balanced market. A reading of 70 means pricing power continues to favor carriers over shippers heading into the fourth quarter. Key takeaways: SONAR PPI, week of Oct. 12, 2026 PPI: 70 (down from 71). Fourth consecutive weekly decline, still firmly carrier-favorable. Three-month outlook: 76 (down from 79). The model gave back most of last week’s gain but still expects carrier leverage to build into mid-January. Capacity is steady. The national tender rejection rate (STRI) was 13.85%, in the 83rd percentile of the past five years. Intermodal contract rates fell to $1.61 a mile from $1.68, the single biggest drag on the index. Spot rates are holding near July levels. The national spot rate eased to $3.52 a mile from $3.56, still in the 95th percentile. Rail volume remains elevated in the 99th percentile as truck-to-rail conversion continues. What pulled the index lower Two metrics accounted for most of this week’s decline. Intermodal contract rates dropped to the 36th percentile from the 54th, taking roughly 0.9 points off the score on their own. Ocean import bookings slipped about 2% to the 48th percentile from the 56th, costing about 0.6 points. Small gains in van contract rates, the spot-contract spread, rejections and accepted volume clawed back about half a point. Capacity: rejections hold in carrier territory The national tender rejection rate was essentially flat at 13.85% versus 13.84% last week. Weekly rejections have stayed between roughly 13.3% and 14.4% since early August, well below the 17–18% peak of late June but still more than two and a half times the level of two years ago. The full report explains why SONAR’s model expects rejections to move higher from here rather than hold at current levels. Demand: rail stays strong, truckload volume stays soft Rail volume eased less than 1% to 35,575 loaded containers but held in the 99th percentile. Truckload carriers continue to be more selective about the freight they accept, pushing loads onto rail on lanes of roughly 550 to 1,500 miles. Accepted truckload volume rose about 1% but remains near the bottom of its range, in the 13th percentile. Ocean import bookings softened yet are still running above last year’s levels. Pricing: contract rates catching up to spot Van contract rates ticked up to $2.74 a mile, moving to the 84th percentile, as carriers reprice contracts upward. The spot-contract spread narrowed to negative $0.11 from negative $0.15. It has been negative since mid-September because spot rates have pulled back from their early-July peak of $3.80 while contract rates keep rising. What the three-month outlook signals The three-month PPI outlook trimmed to 76 but remains well above today’s reading of 70. The model projects tender rejections reaching the 93rd percentile by mid-January, with spot rates and rail volume at the very top of their historical ranges. The full report breaks down the forecast metric by metric. Read the full PPI report The complete SONAR Pricing Power Index report includes charts and analysis for all eight underlying metrics, plus the full three-month forecast. Read the full SONAR Pricing Power Index report inside SONAR Research or in FreightWaves Market Monitor. Look for more data? Request a SONAR demo. About the SONAR Pricing Power Index The SONAR Pricing Power Index is a weekly composite score that measures whether carriers or shippers hold negotiating leverage in the U.S. freight market. It combines eight SONAR metrics (tender rejections, accepted volume, rail volume, ocean TEU bookings, spot rates, van contract rates, the spot/contract spread and intermodal contract rates), ranks each against its own five-year weekly history and weights them into a single score from 0 to 100. A 50 is a historically balanced market. Higher readings favor carriers; lower readings favor shippers. Frequently asked questions What is the SONAR Pricing Power Index (PPI)? The SONAR PPI is a weekly 0–100 score built from eight SONAR freight metrics that shows whether carriers or shippers hold pricing power. A 50 is balanced; above 50 favors carriers; below 50 favors shippers. What is this week’s PPI reading? The SONAR PPI was 70 for the week of Oct. 12, 2026, down from 71 the prior week. It was the fourth consecutive weekly decline. Why did the PPI decline this week? Intermodal contract rates fell to $1.61 a mile from $1.68 and ocean import bookings dropped about 2%. Together they subtracted roughly 1.5 points, partly offset by small gains elsewhere. Do carriers or shippers have pricing power right now? Carriers. At 70, the PPI sits well above the balanced level of 50, supported by tender rejections near 13.9% and spot rates in the 95th percentile. What is the PPI outlook for the next three months? The three-month outlook is 76, down from 79 last week. The model expects tender rejections to climb toward the 93rd percentile by mid-January. The post SONAR Pricing Power Index Slips to 70 as Intermodal Contract Rates Fall appeared first on FreightWaves.
The Google Play Store is getting a big update for cars with Google built-in. On Tuesday, the company announced that the Play Store's layout will now automatically adapt to the size and layout of your car's screen while making it easier to find and download new apps. The update, which is rolling out in the coming weeks, will put featured apps on the Play Store's homepage and allow you to download them with a single tap. It also comes with what Google says is a "streamlined navigation" menu that puts "Apps," "Games," "Search," and "More" options on the left side of your screen (or on the top if your car's screen has a vertical orientation). … Read the full story at The Verge.
CCT Auto Trans announced Tuesday that it has acquired fellow car hauler Livingston Vehicle Transportation Services (VTS). Financial terms of the transaction were not disclosed. Livingston VTS operates one of Canada’s largest vehicle-hauling networks, using its own fleet of trucks and car haulers. It has seven locations nationally and partners with Canadian National (NYSE: CNI) for transcontinental moves. Its customer base spans auto manufacturers to individuals. Livingston VTS was an operating unit of Livingston International, one of Canada’s largest customs brokers. “Livingston VTS has a very solid customer base, dedicated, long-term staff and drivers with assets in most major cities across Canada,” said Chad Doiron, CCT Auto Trans president and CEO, in a news release. “This acquisition positions CCT as the only company in Canada delivering open, enclosed and rail vehicle transport. It provides us with an asset-based, national footprint and the ability to expand in those locations with our current customers.” Parent company CCT Group of Companies will operate Livingston VTS under CCT Vehicle Transportation Solutions. Livingston VTS employees and drivers will transition to the new operation. “We value the contributions our VTS associates have made and are proud of the work they have done over the years to support our customers,” said Livingston CEO Robert Smith. “This is a win for both organizations, allowing VTS operations to continue to grow under the management of a company with a long and successful history in vehicle hauling while enabling Livingston to focus on its core business.” CCT provides finished vehicle transportation with a fleet of 90 open auto carrier units and more than 80 employees, including drivers. The announcement follows other recent deals in the car haul space. In August, finished vehicle transportation provider Acertus announced it acquired Fisher Shipping. The same month, Proficient Auto Logistics (NASDAQ: PAL) acquired Hansen & Adkins for $130 million. Jack Cooper closed its doors in early 2025. Left Lane Associates represented Livingston in the transaction. Why it matters? This acquisition highlights a clear trend toward consolidation within the car haul sector as operators look to gain scale, expand geographies and integrate service offerings. More FreightWaves articles by Todd Maiden: Cass: TL linehaul rates up 10% in September, shipment counts remain positive Yellow Corp., Teamsters settle on WARN Act claims LTL survey: Old Dominion, Daylight Transport take home top honors again The post CCT Auto Trans expands car haul coverage map in Livingston VTS deal appeared first on FreightWaves.
With the weekly average retail diesel benchmark release delayed a day due to the Columbus Day holiday Monday, that lagging indicator is likely to show another decline even as most of the industry discussion these days has been decidedly bullish. Since the Department of Energy/Energy Information Administration price was most recently published October 6, the futures price of ultra low sulfur diesel (ULSD) has been moving in its usual crazy volatility, a feature of the current market since the U.S. and Israel commenced military action against Iran at the beginning of March. But the overall futures market trend in the last week has been higher. ULSD settled October 6 at $4.5694/gallon. Within two days it was more than $4.88/g. It then sunk to a settlement Monday of $4.7232/g, but it wasn’t clear that the Trump diesel deal had any impact; for all of the boasting President Trump did about the transaction, it was only down 1.52 cts/g on the day. (Permitting red dye diesel to be used over the road also has hit a regulatory maze and is largely being dismissed as well). window.googletag = window.googletag || {cmd: []}; googletag.cmd.push(function() { var gptSlot = googletag.defineSlot('/21776187881/FW-Responsive-Main_Content-Slot1', [[300, 100], [320, 50], [728, 90], [468, 60]], 'div-gpt-ad-1709668545404-0').defineSizeMapping(gptSizeMaps.banner1).addService(googletag.pubads()); googletag.pubads().enableSingleRequest(); googletag.pubads().collapseEmptyDivs(); googletag.enableServices(); setInterval(function() { if (!document.hidden) { googletag.pubads().refresh([gptSlot]); } }, 30000); }); googletag.cmd.push(function() { googletag.display('div-gpt-ad-1709668545404-0'); }); On Tuesday at 10:45 a.m. EDT, ULSD was turning in another typical day of volatility. It was at $4.8185/g, up 9.53 cts/g, or 2.02%. But it had been as low as $4.6431/g on the day, for a low to high swing at that point of about 17 cts/g. Will Russia deal bring relief? The DOE/EIA price to be released Wednesday will be the first since the Trump administration announced a deal to purchase Russian diesel, a transaction that has largely been dismissed as irrelevant to supply/demand trends (and the Tuesday upward movement at publication time suggests the broader market was dismissing it as well). The deal with Russia also has been criticized by some members of Congress and others as illegal. While the DOE/EIA number used as the basis for most fuel surcharges is only a weekly number, and can be delayed during a holiday week, there are other price indicators about what’s happening at the pump. The AAA daily diesel price recently completed a 17-day run where the national average fell every day. At the start of that slide on September 22, the price was $6.5276/g. When it ended Friday, AAA said the average daily diesel price was $6.2785/g. It moved up and down slightly the next four days and Tuesday was largely unchanged from Friday. The DTS.USA average retail diesel price in SONAR Tuesday was $6.32/g. The latest DOE/EIA diesel price was $6.199/g, effective October 5. Part of the volatility in the market the past few weeks has been the swing in reports about how much oil is getting through the Strait of Hormuz. Without the one definitive number for the market to agree on, that sort of uncertainty will lead to volatility. window.googletag = window.googletag || {cmd: []}; googletag.cmd.push(function() { var gptSlot = googletag.defineSlot('/21776187881/fw-responsive-main_content-slot3', [[728, 90], [468, 60], [320, 50], [300, 100]], 'div-gpt-ad-1665767553440-0').defineSizeMapping(gptSizeMaps.banner1).addService(googletag.pubads()); googletag.pubads().enableSingleRequest(); googletag.pubads().collapseEmptyDivs(); googletag.enableServices(); setInterval(function() { if (!document.hidden) { googletag.pubads().refresh([gptSlot]); } }, 30000); }); googletag.cmd.push(function() { googletag.display('div-gpt-ad-1665767553440-0'); }); Shipments need help But even if the number is high, as long-time analyst Paul Sankey told CNBC in an interview, what’s getting out is not transiting through the free flow of tankers that was the state of play before the war started. “It’s supplied at enormous military cost,” Sankey said. “That’s how you’re getting the ships through, also with the shuttle tinkering. That’s another level of cost.” He estimated those costs are probably worth about $35/b. Under the terms of the diesel deal announced by President Trump, Russia is to immediately supply more than 300,000 metric tons of diesel to the world market. At a conversion rate of 7.45 barrels of oil per metric tonne, the formula used by S&P Global Energy in its calculations, that works out to 2.235 million barrels. window.googletag = window.googletag || {cmd: []}; googletag.cmd.push(function() { var gptSlot = googletag.defineSlot('/21776187881/fw-responsive-main_content-slot4', [[300, 100], [320, 50], [728, 90], [468, 60]], 'div-gpt-ad-1709668086344-0').defineSizeMapping(gptSizeMaps.banner1).addService(googletag.pubads()); googletag.pubads().enableSingleRequest(); googletag.pubads().collapseEmptyDivs(); googletag.enableServices(); setInterval(function() { if (!document.hidden) { googletag.pubads().refresh([gptSlot]); } }, 30000); }); googletag.cmd.push(function() { googletag.display('div-gpt-ad-1709668086344-0'); }); The rest of the deal would be another 500,000 tonnes in November and 1 million tonnes soon after. At the conversion rate of 7.45 barrels per metric ton, that is 3.725 million b/d for the November quantity and double that for the supply to come after that. U.S. daily consumption of all non-jet fuel distillates, according to the most recent report from the EIA, is about 3.65 million b/d. For the members of the OECD, which consists of most Western economies, daily diesel consumption is estimated at about 13 million b/d. A report from S&P Global Energy quoted Masha Kotkin, a fellow at the Center for Strategic and International Studies, as saying “the amount of diesel Russia can provide would be a drop in the bucket compared to global demand. If you are asking about US diesel prices, I don’t think it’s going to make a difference. It is not very much in the scheme of things.” It’s the products, not the crude The move by the Trump administration to secure additional diesel supplies ultimately goes back to the reality that even if flows out of the Strait of Hormuz are increasing, irrespective of whether they only got there through U.S. military support, consumers buy refined products, not crude. In a separate CNBC interview, Ellen Wald of Transversal Consulting said markets have been able to avoid even higher spikes in price through a wide variety of steps, including drawdowns from strategic stocks. But that has limits. window.googletag = window.googletag || {cmd: []}; googletag.cmd.push(function() { var gptSlot = googletag.defineSlot('/21776187881/fw-responsive-main_content-slot5', [[728, 90], [468, 60], [320, 50], [300, 100]], 'div-gpt-ad-1665767778941-0').defineSizeMapping(gptSizeMaps.banner1).addService(googletag.pubads()); googletag.pubads().enableSingleRequest(); googletag.pubads().collapseEmptyDivs(); googletag.enableServices(); setInterval(function() { if (!document.hidden) { googletag.pubads().refresh([gptSlot]); } }, 30000); }); googletag.cmd.push(function() { googletag.display('div-gpt-ad-1665767778941-0'); }); “We have seen some incredible resilience in the market,” Wald said. “We’ve seen an ability to work around and for the market to find workarounds. But at a certain point, things are going to start to give, and we’re seeing that as prices are creeping higher and higher. Any attempts to bring them down that aren’t actual new sources of supply don’t really last.” (Editor’s note: the picture is AI-generated.) Beyond the latest Russian diesel deal, and before that the agreement by G7 nations earlier this month to release additional strategic stocks, reportedly after a U.S. threat to implement a diesel export ban if they did not, there are the broader stock releases that were agreed upon by the members of the International Energy Agency in March. window.googletag = window.googletag || {cmd: []}; googletag.cmd.push(function() { var gptSlot = googletag.defineSlot('/21776187881/fw-responsive-main_content-slot6', [[728, 90], [468, 60], [320, 50], [300, 100]], 'div-gpt-ad-1665767872042-0').defineSizeMapping(gptSizeMaps.banner1).addService(googletag.pubads()); googletag.pubads().enableSingleRequest(); googletag.pubads().collapseEmptyDivs(); googletag.enableServices(); setInterval(function() { if (!document.hidden) { googletag.pubads().refresh([gptSlot]); } }, 30000); }); googletag.cmd.push(function() { googletag.display('div-gpt-ad-1665767872042-0'); }); IEA executive director Fatih Birol on Saturday tried to give a push to the ongoing releases and have them go faster. “Members that have not yet fully delivered the volumes pledged under the March Collective Action look to see if they are able to accelerate the remaining releases to fulfil this prior commitment, prioritising diesel,” he said in his statement. He also noted that “some members have already released greater volumes than they initially pledged in March.” More articles by John Kingston FMCSA’s Elison: ‘weeks’ away from fixing Motus user experience Wall Street analysts positive on C.H. Robinson deal; S&P more cautious FMCSA split sleeper berth pilot program moves closer to launch The post Russian diesel deal having limited impact, if any, on prices appeared first on FreightWaves.
Truckload linehaul rates surged again in September while shipment counts remained in positive territory, according to a monthly report from Cass Information Systems. Cass’ TL linehaul index, which tracks rates excluding fuel and accessorial surcharges, increased 10.1% year over year, according to Tuesday data from the payments management company. The dataset was up 0.6% from August to the highest absolute reading in four years. The linehaul index is historically heavily weighted to contract rates but includes for-hire spot rates. September marked the 21st straight month of y/y growth (12.9% higher on a two-year-stacked comparison). The report noted the sequential growth rate was 30 basis points below the year-to-date average. It cited a pullback in spot rates and fewer contractual bids “this time of year.” “Even as spot rates slow with modest sequential declines, the much larger contract market is still adjusting higher.” Truckload carriers on hand at investor conference last month noted they remained in a position of strength this bid season. Executives believe that the capacity exodus is growing, not slowing, and that the regulatory crackdown will likely remove thousands more unsafe operators. Management teams were also unfazed earlier this summer when the spot market entered its typical seasonal slowdown. Werner Enterprises’ (NASDAQ: WERN) third-quarter guidance calls for a 10% to 13% y/y increase in rate per total mile at its one-way fleet. Earnings season starts on Thursday when J.B. Hunt Transport Services (NASDAQ: JBHT) reports results after the market closes. Freight shipments recorded by Cass increased 1.9% y/y in September. The y/y increase was the second consecutive following 42 months of declines. Shipments were up 2.3% from August (1.4% higher seasonally adjusted). All domestic transportation modes are included in the index, with TL and less-than-truckload shipments representing the bulk of the dataset. Road-to-rail conversion has weighed on the trucking-centric index in recent months as fuel prices have surged. “With modest retail and industrial growth, and some inventory restocking as container imports surge, freight demand is recovering,” the report said. “The combination of a smaller private fleet and rising new equipment sales also supports higher for-hire volumes.” U.S. manufacturing activity remained in positive territory for a ninth straight month during September. The Institute for Supply Management’s Manufacturing PMI registered a 54.5 reading, with the new orders dataset logging a 55.3 reading. (A reading above 50 for the index signals expansion, while one below 50 indicates contraction.) Cass’ shipments index is forecast to increase 4% y/y in October, assuming normal seasonal patterns hold. Cass’ expenditures index, which measures total freight spend including fuel, jumped 20.4% y/y (up 6.7% sequentially). An increase in shipments, higher freight rates and surging diesel prices drove the index higher. Diesel prices were up 68% y/y in September, 15% higher than August. The expenditures index is expected to increase 23% y/y in October. Data used in the indexes comes from freight bills paid by Cass (NASDAQ: CASS). Cass processes $37 billion in freight payables annually on behalf of customers. Why it matters? September data from Cass highlights a continued surge in TL contract rates, with only modestly improving demand. The dataset confirms the impact strict regulatory enforcement is having on non-compliant capacity. More FreightWaves articles by Todd Maiden: Yellow Corp., Teamsters settle on WARN Act claims LTL survey: Old Dominion, Daylight Transport take home top honors again Transportation prices surge as capacity tightens further in September The post Cass: TL linehaul rates up 10% in September, shipment counts remain positive appeared first on FreightWaves.